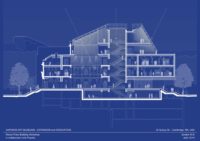

The Sights and Sounds of Harvard Stadium
By Sara Bobok and Do Hyun Kim
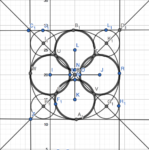
Making Math Material
Fall 2018
Pivotal to community building on Harvard’s campus is the Harvard Stadium, a space for sports, theater, and school spirit. Fascinating mathematics are necessary to allow for the Stadium to fulfill these functions.
Read More