The Sights and Sounds of Harvard Stadium
By Sara Bobok and Do Hyun Kim
Making Math Material
Fall 2018
Pivotal to community building on Harvard’s campus is the Harvard Stadium, a space for sports, theater, and school spirit. Fascinating mathematics are necessary to allow for the Stadium to fulfill these functions.
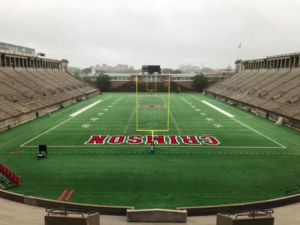
Figure 1. Harvard Stadium (Photo taken by Sara Bobok)
The photographs presented in this paper were taken of the Harvard Stadium on the week of October 1, 2018. Even within just a few photos, countless mathematical concepts can be observed. We will focus on the following: the acoustics of the amphitheater formed by the front of the stadium and the sightlines from differing locations. Through these topics, we were able to apply our interest in math to better understand the theatrical and structural aspects of Harvard Stadium. Understanding these topics can help us better understand how the Stadium serves its critical role on campus to ultimately enrich community building and student opportunities.
- The Sounds –– Amphitheaters in History
For well over two thousand years, art and theater have played a pivotal role in civilization. The earliest performed play of which there are records, “The Persians,” debuted in the fifth century BC. Yet without modern amplification, early actors, directors, and theater enthusiasts alike faced a common problem: how would the audience hear the dialogue?
The amphitheater served as the answer to this dilemma. Due to the inherent acoustic properties of its geometry, spectators clearly heard all music and dialogue without modern sound equipment. How was this possible?
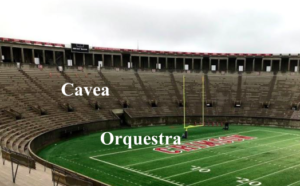
Figure 2. Amphitheater Section of Harvard Stadium with labels (Photo taken by Sara Bobok)
First, it is critical to consider the geometric design of the seating in an amphitheater. Declercq and Dekeyser study the Epidaurus theater in Greece in their critical paper to understand why the acoustics in this amphitheater are so clear. They utilize diffraction theory, or the theory that describes the ways in which light and sound waves change when met by (reflected or absorbed by) a surface, to study the interaction between sound and cavea (a technical word of the audience seating area) for amphitheater acoustics. Seen in the corresponding photographs, amphitheaters are strictly semi-circles. This corresponds well with sound leaving a source, which propagates in spherical wavefronts. Thus, sound waves generally reach each row of seating with similar characteristics (time, frequency, etc). Although the shape of the seats slightly obscures the perfect circular symmetry of the sound waves, this damping effect is not enough to be audible by a human ear. [4]
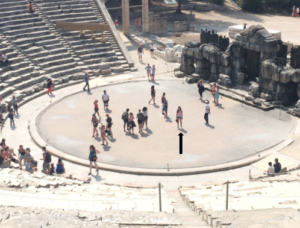
Figure 3. Bobok enjoying the acoustics of the Epidaurus Amphitheater studied by Declercq and Dekeyser (Photo taken by Rose Parisi)
Second, the material used to build amphitheaters greatly impacts the sound clarity. Amphitheaters are typically constructed using limestone. Limestone is a non-porous material and thus reflects, rather than absorbs, sound. However, even with reflected sound, what makes the speech clear and comprehensible? The answer lies in the uniform and geometrical design of the cavea. The key features here are the dimensions of the seats and the slope of the cavea itself. When present, the emitted sound is immediately reflected by the stage building and orchestra floor. The dimensions of the cavea allow for low levels of sound occlusion, which means nearly all speech comes across clearly. Furthermore, the correct frequencies for understandable speech are amplified. [4]
How does this study of acoustics apply to the Harvard Stadium? Geometrically, the Harvard Stadium fits the description of a Roman amphitheater: semi-circular in nature, thereby corresponding with the shape of the sound, and constructed with non-porous concrete material Although it is missing to features Declercq and Dekeyser identify as important––lack of a stage building and porous grass replacing what would otherwise be a limestone orquestra floor––the acoustics still work remarkably well. In the spring of 2018, the Harvard Classics Department and Office for the Arts collaborated with student director Mitchell Polonsky to perform an original translation of “Antigone.” Performing in most parts of the stadium, not just the front amphitheater required that actors have microphones. Yet, in one scene set close to the audience in the amphitheater, performed by actors Jacob Roberts and Aaron Slipper, Roberts and Slipper did not need microphones and were clear and audible by all of the five thousand spectators.
Thus, we find that the circular architecture of the cavea and the non-porous material are what allow the Harvard Stadium’s amphitheater section to provide clear acoustics for its viewers.
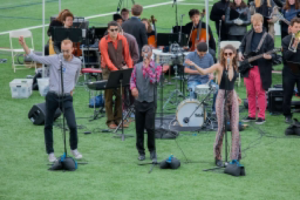
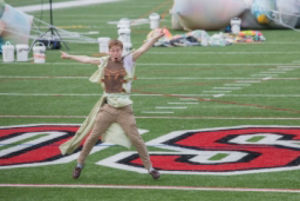
Figure 4a (Left): the musicians of Antigone performing with the use of microphones. Photo Credit: Richard Tong, 2018.
Figure 4b (Right): Roberts at the front of the stadium (which can be determined by his proximity to the “Crimson” lettering), acting without modern sound backing. Photo Credit: Richard Tong, 2018.
The Sights
In addition to thinking about how the seats were designed in relation to sound, it’s also interesting to see how the seats of the Harvard Stadium were designed to help the audience view the field. Like most other football stadiums, the seats are positioned such that each row is slightly elevated compared to the row in front. This is crucial for spectators to be able to view the football field, which is usually at the ground level. In other places, such as a church or a concert hall, seats in the back are not elevated as drastically, if at all. This is because the object the people are trying to view is elevated. An image demonstrates these key differences:
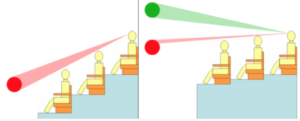
Figure 5. Stadium Seating vs. Standard Seating [6]
The Harvard Stadium was built to play American football. The most popular sport in America attracts millions of people to their TVs, peaking at over 100 million (slightly less than 33
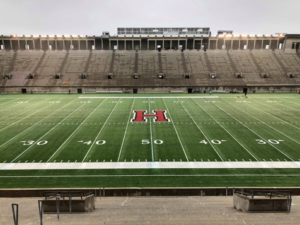
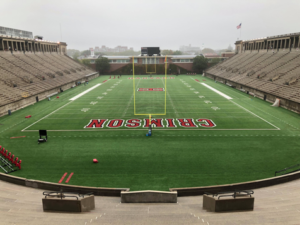
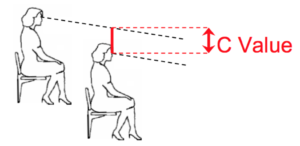
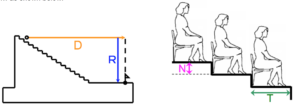
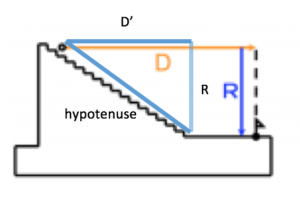
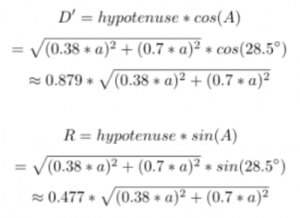
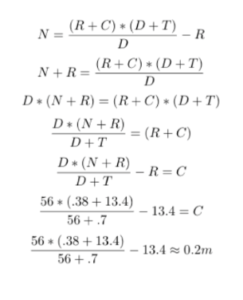
Intuitively, it seems clear that the best seats would be somewhere near the 50-yard line. In fact, there is a blog that explains the “30/30 rule.”[7] In short, sitting anywhere between the 30-yard lines and close to the 30th row allows for the best view of the entire football field. Being able to view the entire field from the middle is much more advantageous than trying to watch the action from the ends of the field. This is because most of the action that occurs during football takes place near the middle of the field, and teams run from end-to-end. Here are some images that help support this notion: Figure 6a. Side view of the Field Figure 6b. Frontal View of the Field As we can see, Figure 7a shows us the middle of the field very well, which makes it easy to see players run from one end to the other. On the other hand, in Figure 7b, it could be difficult to see what is going on when the ball is near the middle or on the other side of the field. So the “between the 30-yard lines” rule makes sense, but how can we mathematically understand why the 30th row is the best? The aforementioned blog [7] goes no further to explain this notion, but we found that there are other concepts we can apply to explore this. It turns out that we can assign a parameter known as the “C-value” to measure the quality of view.[8] Here is a picture provided by Professor Paul Shepherd at the University of Bath that depicts what the C-value is: Figure 7. The C-Value The higher the C-value (measured in mm), the easier it is for spectators to see the field. According to Professor Shepherd, a value of 120 mm is considered “optimal viewing standard.”[8] If the C-value gets too high, the spectator may have more of an “aerial view,” which is not considered to be an optimal viewing point. Professor Shepherd refers us to an equation he claims is used by engineers and architects that will be useful as we attempt to determine where the best seat in Harvard Stadium is. Figure 8. The C-Value Equation Figure 9. The Variables of the C-Value Equation In this equation, N represents the difference in height between successive rows, R represents the vertical height from the field to a particular seat, D represents the horizontal distance from the field to a particular seat, T represents the depth of each row, and C represents the C-value. Using fixed values for N, C, and T, we can try to derive an optimal “R” value that can help us determine the optimal row in Harvard Stadium. We’ll be using the following values, converted to meters (that we measured ourselves or used as standard values, such as for C): N = 0.38 m C = 120 mm = 0.12 m T = 27.5 inches = 0.7 m D = ? Here, we run into an issue. It’s impossible to come up with a fixed value for D, because the value of D depends on which row we are considering, which is what we’re trying to solve. We know that the width of the field is 230 feet.[9] Thus, we can use trigonometry to calculate D’ (horizontal distance from seat to the edge of the field, where the bleachers end), and then simply add 115 feet, or about 35 meters. The hypotenuse can be found by using the Pythagorean Theorem, using “a” as the row number of the particular seat under consideration (in other words, the optimal row number we are looking for). Figure 10. Updated diagram depicting D’, A, and hypotenuse The equation for the hypotenuse is produced below: This hypotenuse completes a triangle using D’ and R as sides. To find angle “A,” we realize this large triangle in Figure 11 is similar to the right triangle that can be created using N and T as the legs. From this, we can use the following equations: We can use angle A to figure out the values of D’ and R in terms of “a.” We recognize that R in this equation does not accurately depict R in Harvard Stadium. The first row actually begins at a certain height above the field. We estimated this height to be around 2 meters. Thus, we will use R’ in our calculations, where R’ = R + 2. We must also remember to use D (instead of D’), using the relationship D = D’ + 35. Plugging in these values allows us to find “a,” the optimal seating row. I computed the value of “a” using WolframAlpha, which gave me an output of about 90. This means that the 86th row offers the ideal viewing point within the stadium. Unfortunately, Harvard Stadium does not have 90 rows, which brings us to a bit of a dilemma. Does this mean that there is no “optimal” C-value for any of the seats at Harvard Stadium? Or does this mean that a C-value of 0.12m is not applicable for Harvard Stadium? We discuss this problem later in this post. We can try to gain some new insight by working backwards: we can use an estimated value for R (an R that corresponds to the 30th row, following the 30/30 rule) and see what C-value we obtain. Taking into account the height of the wall that separates the field from the bleachers, we can again estimate that to be about 2 meters before the first row begins. Thus, an approximate value for R, corresponding to the 30th row, is as follows: R = [(0.38 m) * 30] + 2 = 13.4 m We also need an approximate value for D. Again we can use the fact that we’re at the 30th row: D = [(0.7 m) * 30] + 35 = 56 m Let’s plug this into the equation to solve for C: We obtained a C-value of 0.2m, which is well above the proposed optimal viewing value. In fact, doing the calculation for the 15th row gives us a C-value of 0.257, while the 1st row gives us a C-value of 0.327. It may be useful to examine the possible assumptions of the C-value equation to better understand why we are obtaining such a high C-value for the 30th row seats at Harvard Stadium, and the C-value continues to increase as we go lower. Although Professor Shepherd described the 120mm C-value as the “optimal viewing standard,” it might be more likely that this value is a minimum value for good viewing.[8] Intuitively, this makes sense because being able to have a larger C-value means that there the view is less obstruction by the person in front. Knowing that a high C-value is good doesn’t explain why the 1st row at Harvard Stadium seems to be “the most optimal.” One can reasonable notice that people sitting in the first row may actually have a limited view of the field, since they don’t have a great view of the opposite side of the field. Perhaps there are some necessary conditions in order to use the C-value equation effectively. The mathematical calculations of the C-value support the notion that view obstruction is not a major concern at Harvard Stadium. It’s possible that the equation is more applicable for places where visual obstruction is more prevalent. Going through the concept and mathematical analysis of the C-value taught us not only where theoretically the “just optimal” seats at Harvard Stadium are (the non-existent 90th row), but it also seemed to imply that visual obstruction is not an issue at Harvard Stadium by showing that the 31 rows at Harvard seem to have a higher-than-optimal C-value. Using concepts such as acoustics and C-values to analyze the design of the Harvard Stadium provided some insights into a place that many people visit every year. It helped us appreciate the engineering and architectural thoughts that went into the construction as well. Through mathematics, we can better understand the beauty that lies behind the structural and aesthetic components of the structures around us. Sources and Acknowledgments Special thanks to Richard Tong for providing the images in Figures 4a and 4b. [1] Williams, Kim, & Ostwald, Michael J. (2015). Architecture and Mathematics from Antiquity to the Future: Volume I: Antiquity to the 1500s (2015 ed.). Cham: Springer International Publishing. [2] Mourjopoulos, John. “The Origins of Building Acoustics for Theatre and Music Performances.”https://acoustics.org/the-origins-of-building-acoustics-for-theatre-and-music-performances-john-mourjopoulos/ [3] Miller, Melinda. “How Does Acoustical Absorption Work?” 22 Feb 2018. https://www.abdengineering.com/blog/how-does-acoustical-absorption-work/ [4] Declercq, N, and Dekeyser. “Acoustic Diffraction Effects at the Hellenistic Amphitheater of Epidaurus: Seat Rows Responsible for the Marvelous Acoustics.” The Journal of the Acoustical Society of America, vol. 121, no. 4, 2007, pp. 2011–2022. [5] Farnetani, Andrea, et al. “On the Acoustics of Ancient Greek and Roman Theaters.” The Journal of the Acoustical Society of America, vol. 124, no. 3, 2008, pp. 1557–67. [6] Stadium seating. https://en.wikipedia.org/wiki/Stadium_seating [7] Hanson, Keith. “Where to Sit for a Football Game.” 4 Sep 2015. https://www.rateyourseats.com/blog/cheap_seats/where-to-sit-for-a-football-game [8] Shepherd, Paul. “Sightlines.” 2012. http://people.bath.ac.uk/ps281/maths_talk/olympic/teacher_notes/worksheet_sightlines.pdf. [9] Lottman, Michael. “Nation’s Oldest Stadium Has Colorful Past.” 7 Nov 1959. https://www.thecrimson.com/article/1959/11/7/nations-oldest-stadium-has-colorful-past/.